python 畫(huà)圖 圖例自由定義方式
我就廢話不多說(shuō)了,還是直接看代碼吧!
# -*- coding: utf-8 -*-'''Created on Wed Mar 7 13:10:21 2018 @author: su''' import numpy as npimport matplotlib.pyplot as plt n_groups = 2 num_list = [0.8,0.80] num_list1 = [0.8,0.8] num_list2 = [0.9,0.9] num_list3 = [0.9,0.9] fig, ax = plt.subplots()plt.grid(True, linestyle = '-', color = '#9dbcd4', linewidth = '0.7',axis= ’y’) ax = plt.gca()ax.spines[’top’].set_visible(False) #去掉上邊框ax.spines[’right’].set_visible(False) #去掉右邊框ax.spines[’bottom’].set_visible(False) #去掉上邊框ax.spines[’left’].set_visible(False) #去掉右邊框ax.tick_params(axis=’y’,width=0,length=0)ax.tick_params(axis=’x’,width=0,length=0)index = np.arange(n_groups)bar_width = 0.5opacity = 1rects1 = plt.bar(index, num_list, bar_width/4,alpha=opacity, color=’#6B7C85’,label=’Logistic’,hatch=’’)rects2 = plt.bar(index + bar_width/4, num_list1, bar_width/4,alpha=opacity,color=’#9dbcd4’,label=’SVM’,hatch=’/’)rects3= plt.bar(index + bar_width/2, num_list2, bar_width/4,alpha=opacity,color=’#1f3d4b’,label=’CNN’,hatch=’-’)rects4= plt.bar(index + bar_width*3/4, num_list3, bar_width/4,alpha=opacity,color=’#3f829d’,label=’LSTM’,hatch=’:’) # plt.xlabel(’Group’)plt.ylabel(’Accuracy’, fontsize=18)# plt.title(’Scores by group and gender’)plt.xticks(index - 0.3+ bar_width, (’Chinese’, ’English’),fontsize =18) plt.yticks(fontsize =18) #change the num axis size plt.ylim(0.7,0.95) #The ceil # 設(shè)置legendplt.legend(loc=’center’, bbox_to_anchor=(0.5,-0.2),ncol=4,frameon=False,shadow=False)plt.tight_layout() plt.show()
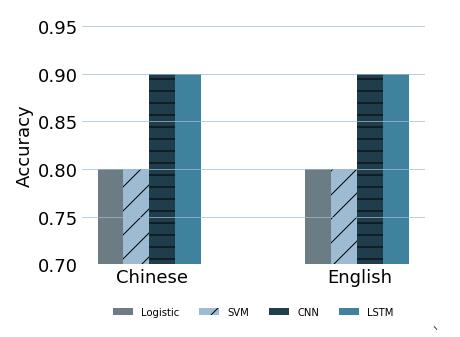
去除邊框,圖例放圖下面。設(shè)置橫標(biāo)線
以上這篇python 畫(huà)圖 圖例自由定義方式就是小編分享給大家的全部?jī)?nèi)容了,希望能給大家一個(gè)參考,也希望大家多多支持好吧啦網(wǎng)。
相關(guān)文章:
1. js實(shí)現(xiàn)跳一跳小游戲2. PHP設(shè)計(jì)模式(四)原型模式Prototype實(shí)例詳解【創(chuàng)建型】3. Python編寫(xiě)nmap掃描工具4. JVM之class文件結(jié)構(gòu)5. 10個(gè)提供免費(fèi)PHP腳本下載的網(wǎng)站6. js實(shí)現(xiàn)貪吃蛇小游戲(加墻)7. Django通過(guò)設(shè)置CORS解決跨域問(wèn)題8. SpringBoot 開(kāi)發(fā)提速神器 Lombok+MybatisPlus+SwaggerUI9. 使用idea 去除 html 代碼前的行號(hào)和空行的方法詳解10. php5.6不能擴(kuò)展redis.so的解決方法

 網(wǎng)公網(wǎng)安備