Python figure參數及subplot子圖繪制代碼
1. Python的figure參數主要有:
def figure(num=None, # autoincrement if None, else integer from 1-N figsize=None, # defaults to rc figure.figsize dpi=None, # defaults to rc figure.dpi facecolor=None, # defaults to rc figure.facecolor edgecolor=None, # defaults to rc figure.edgecolor frameon=True, FigureClass=Figure, clear=False, **kwargs ):
可以設置圖片大小、分辨率、顏色等。
2. subplot子圖繪制,子圖的繪圖參數可以分別設置
plt.figure(1)x1 = np.linspace(-0.2, 2, 10)y1 = x1**2 + 0.3plt.subplot(121)plt.scatter(x1, y1)plt.xlabel(’X’)plt.ylabel(’Y’)plt.title(’test_1’)x2 = np.linspace(-0.2, 2, 10)y2 = x2 + 0.3plt.subplot(122)plt.plot(x2, y2, color='red', linewidth=1.0, marker = ’s’, linestyle='--')## plt.plot(x, y, color='#ef5492', linewidth=2.0, marker = ’s’, linestyle='--')# plt.plot(x2, y2, ’rs--’) plt.xlabel(’X’)plt.ylabel(’Y’)plt.title(’test_2’)plt.show()
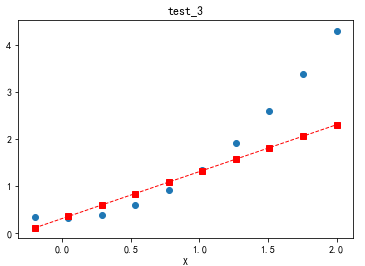
3. 在同一張圖片上顯示多種圖形,簡單說把 plt.show()放在最后即可
import matplotlib.pyplot as pltimport numpy as npplt.figure(2)x1 = np.linspace(-0.2, 2, 10)y1 = x1**2 + 0.3plt.scatter(x1, y1)x2 = np.linspace(-0.2, 2, 10)y2 = x2 + 0.3plt.plot(x2, y2, color='red', linewidth=1.0, marker = ’s’, linestyle='--')## plt.plot(x, y, color='#ef5492', linewidth=2.0, marker = ’s’, linestyle='--')# plt.plot(x2, y2, ’rs--’) plt.xlabel(’X’)plt.ylabel(’Y’)plt.title(’test_3’)plt.show()
以上就是本文的全部內容,希望對大家的學習有所幫助,也希望大家多多支持好吧啦網。
相關文章:
1. python實現感知機模型的示例2. Python unittest單元測試框架實現參數化3. .net core 中 WebApiClientCore的使用示例代碼4. springboot多模塊包掃描問題的解決方法5. Android Studio編寫AIDL文件后如何實現自動編譯生成6. iOS UIScrollView和控制器返回手勢沖突解決方法7. 深入淺出 妙用Javascript中apply、call、bind8. windows下安裝PHP性能分析工具 xhprof 筆記9. 基于vue實現探探滑動組件功能10. 利用google trends來觀察一下Java技術的發展趨勢

 網公網安備
網公網安備